
Grafana Cloud is an Open-source observability and dashboarding platform by Grafana Labs. This profile pulls together Grafana Cloud's ratings across the major review sites, its company and funding details, leadership, features, pricing, and the latest news, with every external source cited at the bottom.
About Grafana Labs
Grafana Labs is a New York-based observability company founded in 2014 by Torkel Ödegaard, Anthony Woods, and Carl Bergquist. Grafana started as an open-source dashboard tool for Graphite and evolved into the leading visualization and observability platform.
Grafana Cloud is the managed SaaS offering that combines Grafana dashboards with Loki (logs), Tempo (traces), Mimir (metrics), and k6 (load testing) into one unified observability stack.
The platform integrates with Prometheus natively and is the de facto standard for Kubernetes and cloud-native monitoring. Grafana Labs raised $240M at a $6B valuation in 2022 and has over 3,000 customers including Bloomberg, Microsoft, and DoorDash.
| Category | Open-source observability and dashboarding platform |
| Company | Grafana Labs |
| Founded | 2014 |
| Headquarters | New York, New York, US |
| Industry | Software Development · Observability |
| Team size | ~1,000-1,500 |
| Ownership | Private, Series D ($240M, 2022, $6B valuation) |
| Founder / CEO | Torkel Ödegaard (CTO), Anthony Woods, Carl Bergquist |
| Specialties | Dashboarding, metrics (Mimir/Prometheus), logs (Loki), traces (Tempo), load testing (k6) |
| Website | grafana.com |
Find Grafana Cloud on: Crunchbase · LinkedIn · G2
Grafana Cloud ratings across the web
Aggregated from the major review platforms. Each links to the source.
Rating breakdown
Per-category scores from G2, ~200 reviews, 2025-2026.
Who uses Grafana Cloud
Grafana Cloud reviews from Topickz readers
Reader-submitted and moderated. This is separate from the third-party scores above. Verified-buyer reviews are labeled.
Be the first to review Grafana Cloud. Your honest take helps the next buyer decide.
Review Grafana Cloud
Your honest take, in about two minutes. We verify each review before it publishes.
What people say about Grafana Cloud
Our synthesis across ~200 G2 reviews and extensive community discussion, 2025-2026. No fabricated quotes, this is the consistent pattern across reviews and third-party analyses.
Most praised
- Best-in-class Prometheus and Kubernetes dashboard ecosystem
- Loki log aggregation is significantly cheaper than Elastic/Datadog for log storage
- Free tier is genuinely usable for smaller teams and projects
- LGTM stack (Loki, Grafana, Tempo, Mimir) provides full observability without vendor lock-in
Most cited complaints
- Setup complexity is high compared to managed offerings like Datadog
- Dashboard creation has a learning curve for non-technical users
- Alert management is less polished than Datadog or PagerDuty
What we found testing it
What's great
- Composable open-standards stack: Prometheus for metrics, Loki for logs, Tempo for traces, all OpenTelemetry-native
- Pro plan starts at $19/month plus usage; the free tier covers 10K active metric series, 50GB logs/traces, and 14-day retention
- Named Gartner Magic Quadrant Leader in Observability Platforms, confirming enterprise-readiness
Watch-outs
- Requires more operational maturity to configure; a Prometheus/Loki stack takes days to tune, not hours
- Free tier is legitimately free but real production workloads hit the limits within days
- Metrics pricing at $6.50/1K series beyond the free tier can escalate if your cardinality is high
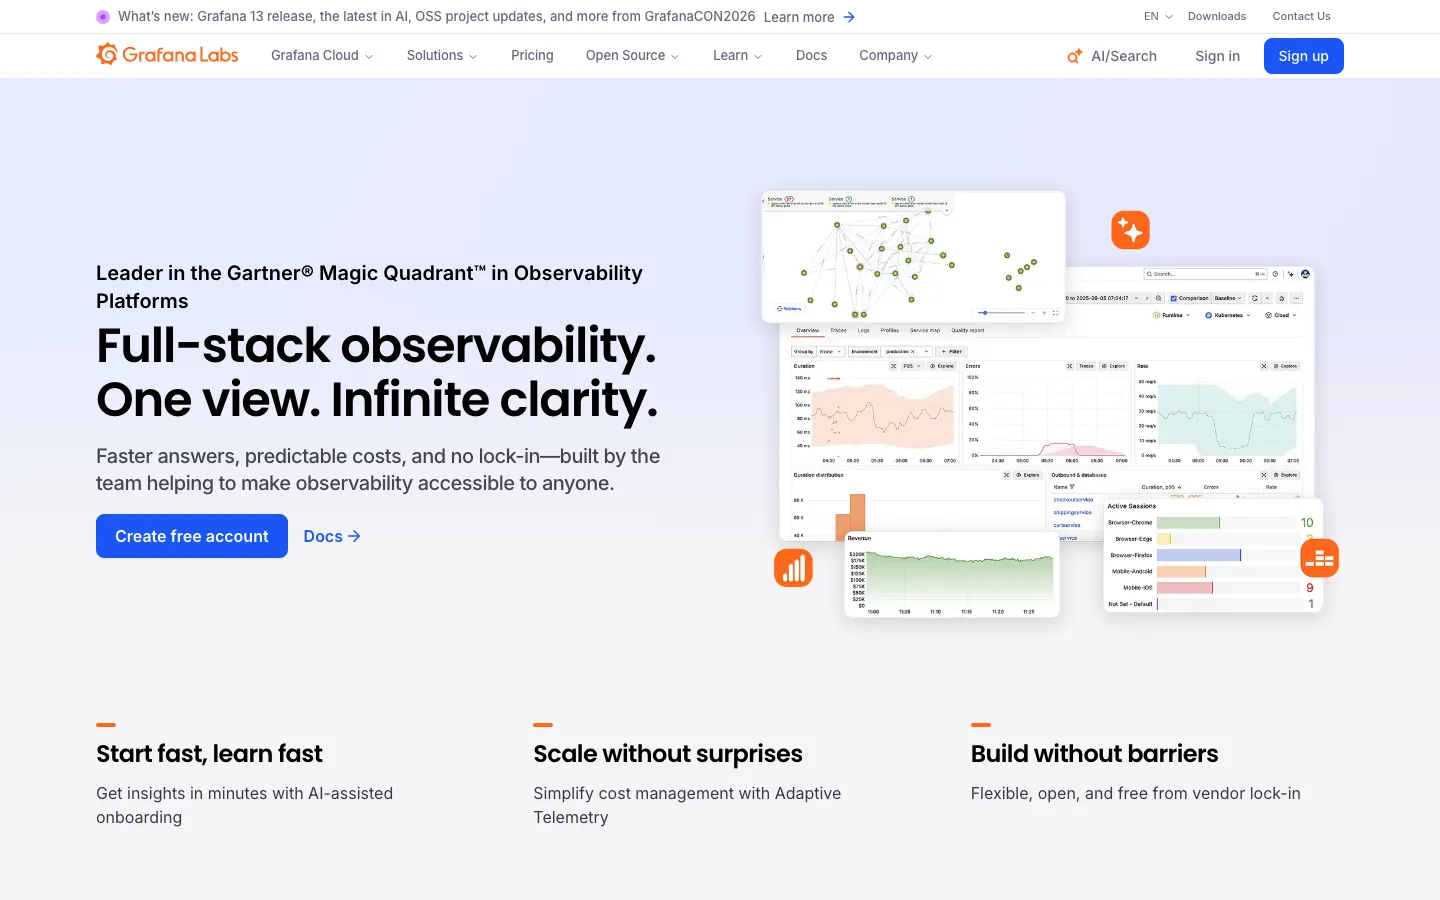
Grafana Cloud funding & ownership
| Round | Amount | Date | Lead investor |
|---|---|---|---|
| Series A | $12M | 2019 | Lead Edge Capital |
| Series B | $50M | 2020 | GIC |
| Series C | $150M | 2021 | Sequoia |
| Series D | $240M | 2022 | GIC |
Grafana Cloud features & integrations
Security & compliance
| Standard | Availability |
|---|---|
| GDPR | Yes |
| HIPAA | Yes (Enterprise) |
| SOC 2 Type II | Yes (Type II) |
| SSO / SAML | Yes (Pro+) |
Integrations: Prometheus, Kubernetes, AWS, Azure, GCP, Datadog (migration), Elasticsearch, InfluxDB, MySQL, PostgreSQL, Jaeger, Zipkin, and OpenTelemetry.
Grafana Cloud leadership
Grafana Cloud pricing
| Plan | Price | Best for |
|---|---|---|
| Free | $0/mo | Small teams, dev environments, 50GB each |
| Pro | Pay-as-you-go from $8/mo | Production workloads, scalable pricing |
| Advanced | Custom | Large orgs, SLAs, dedicated support |
The catch: Grafana Cloud charges on usage. Free: 50GB metrics, 50GB logs, 50GB traces. Pro: starts at $8/month with pay-as-you-go rates. Usage pricing: $0.009/GB for logs, $8/1000 active Prometheus series, $0.005/GB for traces.
Cost is often 50-70% cheaper than equivalent Datadog spend for metric-heavy workloads.
Grafana Cloud alternatives & where it appears
Featured in our guides
Grafana Cloud product changelog
What Grafana Cloud has actually shipped, summarized from its own release notes and dated. Not auto-generated, updated as part of our freshness checks.
- February 1, 2026
- October 1, 2025
- February 1, 2025
Latest Grafana Cloud news
Auto-pulled from Google News, refreshed on each deploy. Headlines link to the source.
- Grafana Turns Cypress Test Results into Persistent Observability Data - infoq.comFri, 25 Sep 2026
- Grafana Labs Acquires Pyroscope to Add Code Profiling Capability - DevOps.comMon, 12 Oct 2026
- Grafana Labs Partners with AWS to Accelerate Open Observability Adoption at Scale - HPCwireWed, 23 Sep 2026
- Deploying a Replicated M3DB Cluster on Oracle Kubernetes Engine with Grafana Observability - Oracle BlogsThu, 03 Sep 2026
- Prometheus and Grafana Setup: 12 Steps, 50 Min [2026] - tech-insider.orgSun, 19 Jul 2026
- Grafana Labs Named a Leader in 2026 Gartner® Magic Quadrant™ for Observability Platforms and Positioned Furthest in Completeness of Vision - Yahoo FinanceWed, 15 Jul 2026
Grafana Cloud FAQs
Is Grafana really open source?
How does Grafana Cloud compare to Datadog?
Sources
Every external figure on this page traces to a public source, last collected on the dates shown.
- Grafana Cloud website — Product and pricing (accessed 2026-09-02)
- G2 Grafana reviews — User reviews (accessed 2026-09-02)