

Comparing the best Business Intelligence Tools of 2026 includes 1. Tableau 2. Microsoft Power BI 3. Looker (Google Cloud) 4. Sigma Computing 5. Metabase 6. Hex 7. Domo 8. Sisense 9. ThoughtSpot.
TL;DR
- Tableau: Best overall for self-serve visualization. The viz layer is still the segment benchmark, so watch the $75/user/mo Creator seat cliff once your team needs several people building, not just viewing.
- Microsoft Power BI: Best for Microsoft 365 shops. Pro is $14/user/mo, and if you are already on Microsoft 365 E5 you get it bundled at no extra cost.
- Looker (Google Cloud): Best semantic layer and data governance. LookML is the most mature semantic layer in commercial BI, so your CFO and PM get the same number every time they ask for the same metric.
- Sigma Computing: Best warehouse-native spreadsheet BI. If you live in Excel or Google Sheets, you can explore live Snowflake or BigQuery data with no extract and no new data model to learn.
- Metabase: Best open-source self-serve for budget teams. The self-hosted tier is free with unlimited users, and teams routinely ship working dashboards inside a week.
Nine BI platforms compared across the full range of buyers, from a seed-stage startup running Metabase on a $100/month budget to a 600-person SaaS org migrating off Tableau into Sigma. What each tool wins on, where it breaks down, and the pick for your warehouse, your team structure, and your SQL comfort level.
What Are BI tools?
BI tools help teams turn raw data into dashboards and reports, connecting to databases and warehouses so anyone can explore metrics and answer business questions.
Tools like Tableau, Power BI, Looker, and Sigma differ on ease of use, modeling, governance, and how they price at scale.
Best Business Intelligence Tools comparison: features, pricing and verdicts
| Tool | Best for | Starting price | Free trial | External rating |
|---|---|---|---|---|
Best overall for self-serve visualization | $15/user/mo | 14-day free trial | G2 4.4/5 (3,653 reviews) | |
Best for Microsoft 365 shops | $14/user/mo | Free tier | G2 4.5/5 (1,630 reviews) | |
Best semantic layer and data governance | ~$5,550/mo | Demo only | G2 4.4/5 (1,643 reviews) | |
Best warehouse-native spreadsheet BI | ~$300/mo | Demo only | G2 4.4/5 (557 reviews) | |
Best open-source self-serve for budget teams | $0 | Free tier | G2 4.4/5 (146 reviews) | |
Best for analyst-first collaborative notebooks | $36/mo | Free community tier | G2 4.5/5 (393 reviews) | |
Best for non-technical exec dashboards | ~$30,000/yr | 30-day free trial | G2 4.3/5 (1,005 reviews) | |
Best for embedded customer-facing analytics | ~$25,000/yr | Demo only | G2 4.2/5 (1,062 reviews) | |
Best natural-language search BI | $25/user/mo | Demo only | G2 4.4/5 (330 reviews) |
How we chose these tools
We compared the platforms on pricing, real G2 review themes, SQL passthrough and semantic layer depth, warehouse-native architecture, dbt integration, and hands-on feature checks. Pricing was verified directly on vendor pricing pages in May 2026. All G2 review counts were pulled on May 28, 2026.
How we weight business intelligence tools for the Topickz score
Every tool above is scored against the fixed rubric below and combined using these weights into the Topickz score on each card. The weights are set for business intelligence tools specifically, they are not copied from another category, and we publish them so you can see what moved a ranking and re-weight for your own priorities.
| Criterion | Weight | What we checked |
|---|---|---|
| Semantic layer and modeling | 21% | How mature the metrics and modeling layer is, so the same metric returns the same number for everyone who asks. A weak layer means every team reports a different revenue figure. |
| Visualization depth | 18% | The range and quality of charts and dashboards, and how far self-serve exploration goes before you hit a wall. |
| SQL passthrough | 13% | How directly an analyst can drop to raw SQL when the GUI runs out, without fighting the tool. |
| Warehouse-native architecture | 12% | Whether it queries Snowflake or BigQuery live, or pulls data into its own extract engine first. |
| Pricing and seat model | 12% | Cost at scale and the Creator or Viewer seat cliffs that surprise a growing team once several people need to build, not just view. |
| dbt integration | 10% | How cleanly it picks up dbt models and metrics already defined upstream, instead of redefining them by hand. |
| Governance | 8% | Row-level security, permissions, and version control for the reports a whole company depends on. |
| Ease of use | 6% | How fast a non-analyst gets to a working dashboard on their own. |
| Total | 100% |
Read the full TopickZ.com testing methodology for how we run each test, score every criterion, and combine them into a single rating.
Detailed reviews
Tableau
Best overall for self-serve visualization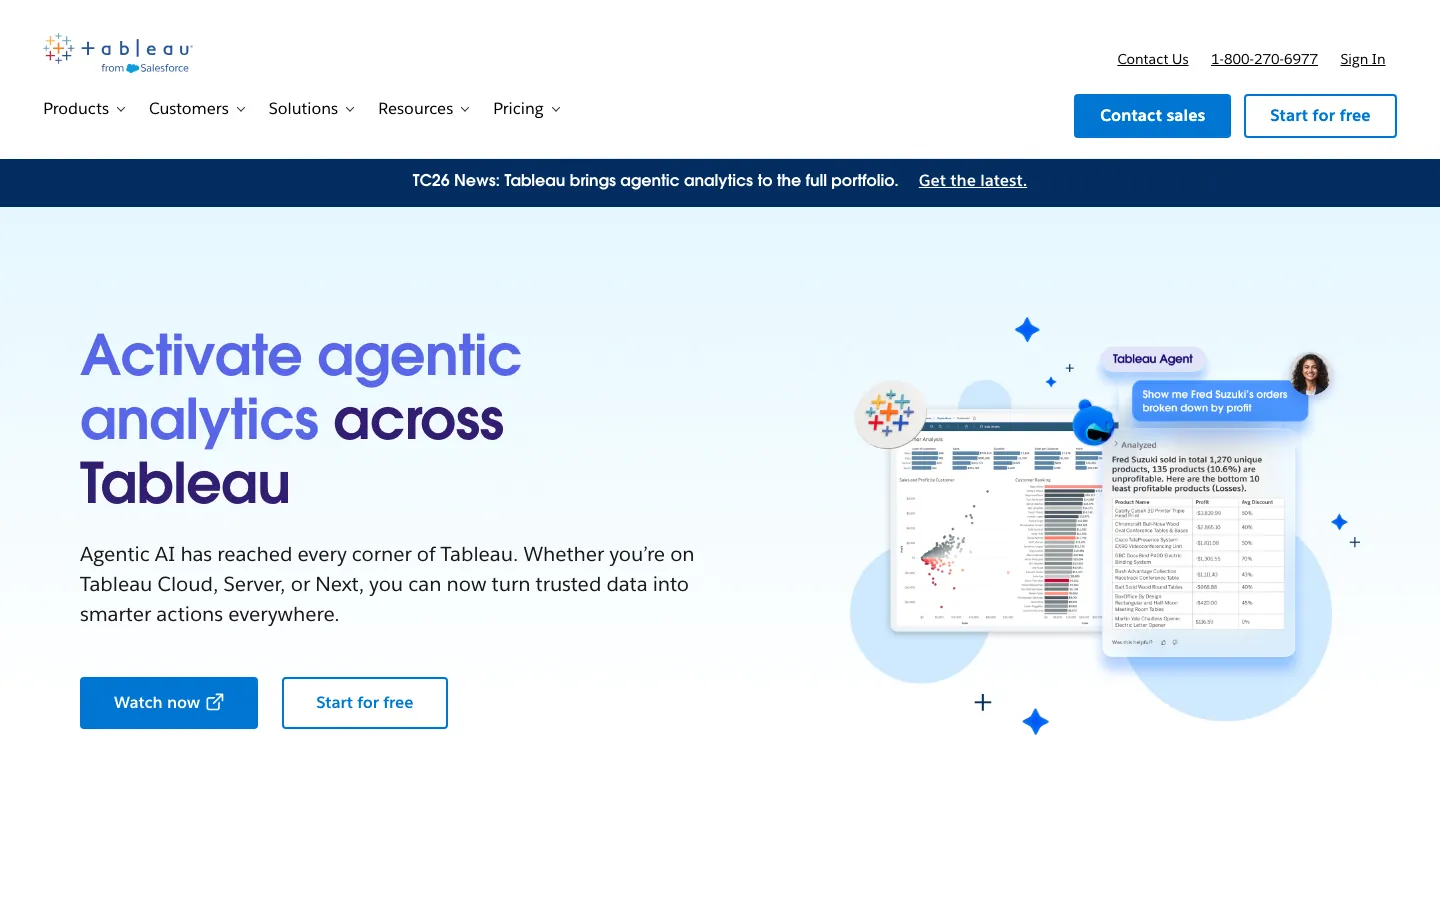
Screenshots of Tableau 3 images
What's great
- Most flexible visualization layer in the segment; calculated fields, LOD expressions, and table calculations give analysts control that Power BI DAX rarely matches cleanly
- Prep Builder ships with Creator license and handles row-level transformation without a separate ETL tool
- 1,000+ data connectors across cloud warehouses, flat files, and operational databases; the breadth is real
Watch-outs
- Creator seats at $75/user/mo hit hard when half the team needs to build, not just view; a 5-Creator team costs $4,500/mo billed annually
- No native semantic layer; metric drift across dashboards is a common complaint, where teams eventually write their own "the real ARR dashboard" workaround
- Salesforce acquired Tableau in 2019 and roadmap investment has slowed on core analytics features relative to Sigma and Hex
Tableau is still the tool the analytics world benchmarks against for visualization. 3,653 G2 reviews average 4.4/5, with consistent praise for the depth of the viz layer and consistent complaints about pricing and the lack of a governed semantic layer. The Creator seat cliff is real.
A team that needs several people building, not just viewing, runs into the $75/user/mo Creator tier fast, which is fine for mid-market but puts Tableau out of reach for early-stage teams.
Mammoth.io’s Tableau pricing breakdown confirms Enterprise edition Creator seats at $115/user/mo, which is where large-org deployments land. Best pick for analytics teams where business-user self-serve is the primary motion and where the data team has enough bandwidth to enforce naming conventions manually.
Pricing breakdown
| Plan | Price | Best for |
|---|---|---|
| Viewer (Standard) | $15/user/mo | Business users who read dashboards only |
| Explorer (Standard) | $42/user/mo | Analysts who need to modify existing workbooks |
| Creator (Standard) | $75/user/mo | Analysts building new data sources and dashboards |
| Creator (Enterprise) | $115/user/mo | Enterprise deployments with Slack and Salesforce integration |
What reviewers say about Tableau
Recurring themes across ~3,653 G2 reviews (4.4/5) plus Capterra and BI review roundups, 2024-2026.
What reviewers praise
- The drag-and-drop visualization engine is the most-cited strength: reviewers build clean, interactive dashboards and drill down or filter in real time without writing code, which makes it a favorite for leadership reporting and data storytelling.
- Chart quality and design flexibility come up constantly, with users saying Tableau produces more polished, presentation-ready visuals than most competing BI tools.
- Broad data-source connectivity (Excel, cloud warehouses, databases, APIs) lets teams blend sources into one dashboard, and reviewers value how flexibly it slots into existing stacks.
- The interactivity, filters, drill-downs, and parameters, is praised for letting business users explore data themselves instead of waiting on an analyst to re-run a report.
- A large user community and deep learning resources mean answers to most problems are already documented, which reviewers say shortened their ramp-up.
What reviewers fault
- Cost is the single most repeated complaint: the per-role licensing (Creator, Explorer, Viewer) adds up fast, and small teams, nonprofits, and students frequently say they switched to or considered Power BI purely on price.
- Performance degrades on very large datasets and live connections, with dashboards taking noticeably long to load when data volumes climb.
- The pricing structure itself is called confusing, not just expensive, because buyers struggle to predict total cost across the different seat types.
- Building advanced or highly customized workflows often pushes users into external tools, and version control and collaborative development are weaker than in developer-oriented platforms.
- The learning curve for advanced features (LOD expressions, calculated fields, complex joins) is steep, and reviewers note that surface-level dashboards are easy but true mastery takes real time.
Loading reviews…
Microsoft Power BI
Best for Microsoft 365 shops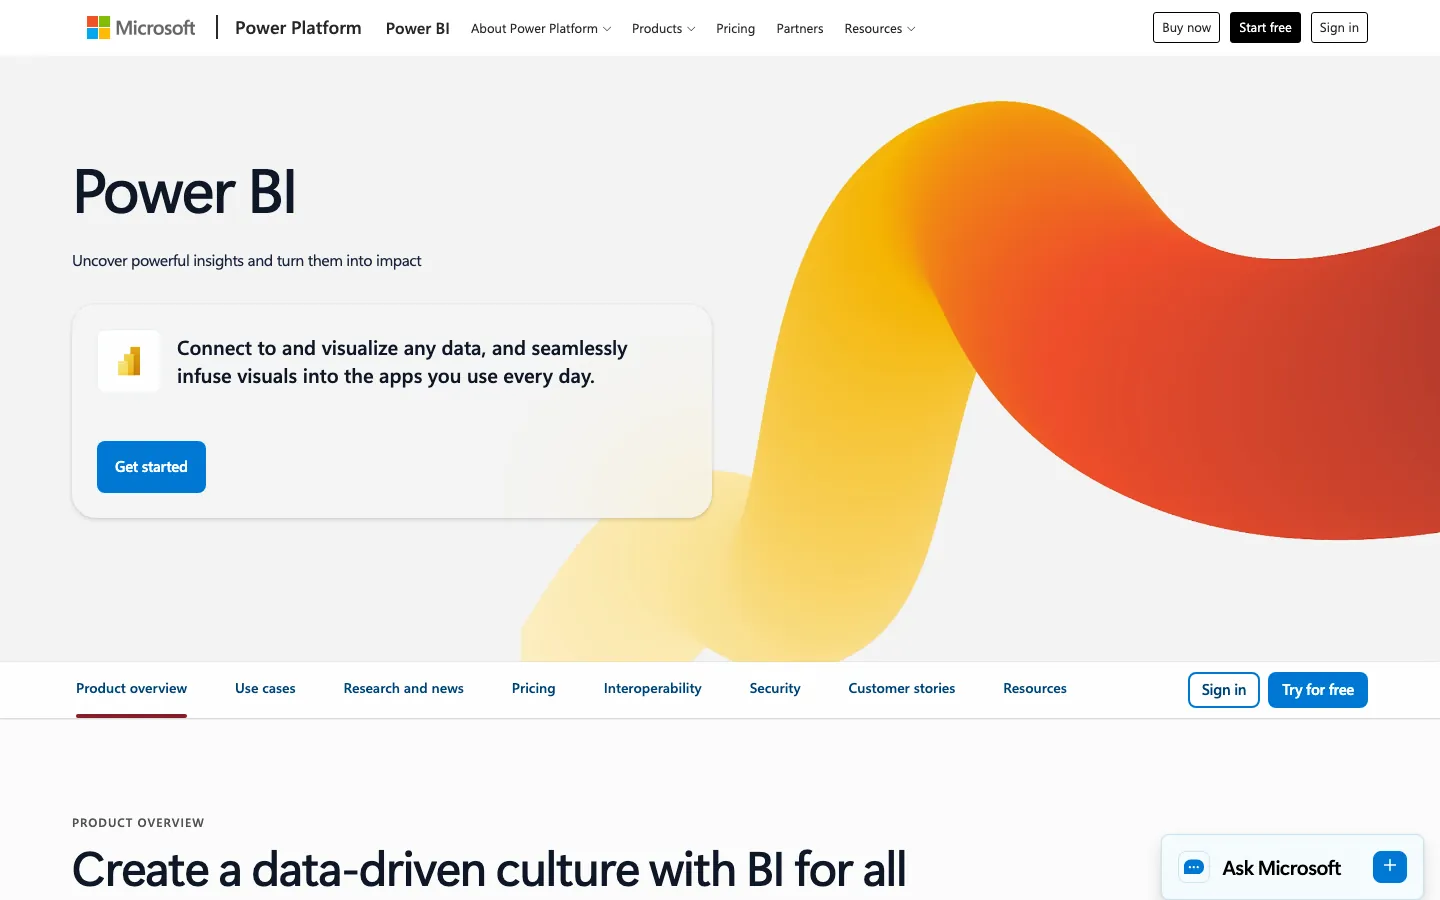
Screenshots of Microsoft Power BI 3 images
What's great
- Pro at $14/user/mo is the lowest per-user cost for a commercial BI tool with real governance features; orgs on Microsoft 365 E5 get it bundled at no incremental cost
- DAX and Power Query are genuinely powerful once mastered; complex time-intelligence and many-to-many relationships that Tableau handles awkwardly are native in Power BI
- Direct integration with Teams, SharePoint, and Excel means finance and ops teams can live in their normal workflow while analysts publish clean reports
Watch-outs
- DAX has a steep learning curve that regularly shows up as the top complaint across G2 reviews; beginners often write slow, incorrect measures without knowing it
- The free tier limits sharing; you cannot publish to colleagues without both parties having a Pro or Premium Per User license
- Microsoft raised Pro from $10 to $14 per user in April 2025, and Premium Per User from $20 to $24. Worth knowing before budget conversations
Power BI is the pragmatic call when your company is already inside Microsoft 365. 1,630 G2 reviews average 4.5/5, the highest rating in this guide at scale. The pricing math is genuinely favorable for Microsoft shops.
A 50-person team all on Pro comes to $700/mo, which is half what the equivalent Tableau Explorer count costs. Microsoft’s own Power BI pricing page lists Pro at $14/user/mo and Premium Per User at $24/user/mo, the prices that took effect with the April 2025 increase.
If you’re not in the Microsoft ecosystem, the DAX learning curve and the SharePoint-native sharing model become friction points that other tools don’t have.
Pricing breakdown
| Plan | Price | Best for |
|---|---|---|
| Free | $0 | Individual analysis |
| Pro | $14/user/mo | Teams sharing reports and dashboards |
| Premium Per User | $24/user/mo | Paginated reports |
| Fabric Capacity | Custom | Enterprise workloads |
What reviewers say about Microsoft Power BI
Recurring themes across ~1,630 G2 reviews (4.5/5) plus Capterra and BI review roundups, 2024-2026.
What reviewers praise
- Tight integration with the Microsoft stack (Excel, Teams, Azure, SharePoint) is the top-cited advantage, with reviewers saying data flows in from tools they already run and reports land where colleagues already work.
- Low entry cost relative to Tableau and other enterprise BI comes up repeatedly as the reason teams picked it, especially the affordable per-user Pro license.
- The drag-and-drop report canvas lets non-technical users build dashboards and explore data without SQL, and reviewers praise how quickly Excel-literate staff get productive.
- Broad visualization options plus a marketplace of custom visuals give teams flexibility, and newer AI features like Copilot draw positive early mentions.
- Power Query for data prep and transformation is singled out as genuinely powerful for cleaning and shaping data before it hits a report.
What reviewers fault
- DAX is the most common frustration: the formula language behind any serious modeling is powerful but unintuitive, and reviewers describe a steep curve mastering measures and star-schema design.
- Performance slows on large datasets and complex data models, with sluggish refreshes and laggy dashboards flagged often.
- Licensing cost creeps up once you share reports widely or with external stakeholders, and Premium capacity pricing surprises teams that outgrow Pro.
- The Windows and Azure lean is a recurring gripe: Power BI Desktop is Windows-only and some sharing and auth workflows assume Azure Active Directory, which frustrates Mac and non-Microsoft shops.
- The gap between the easy report canvas and the hard modeling layer means reviewers underestimate the skill needed, and hit a wall when simple visuals give way to real data modeling.
Loading reviews…
Looker (Google Cloud)
Best semantic layer and data governance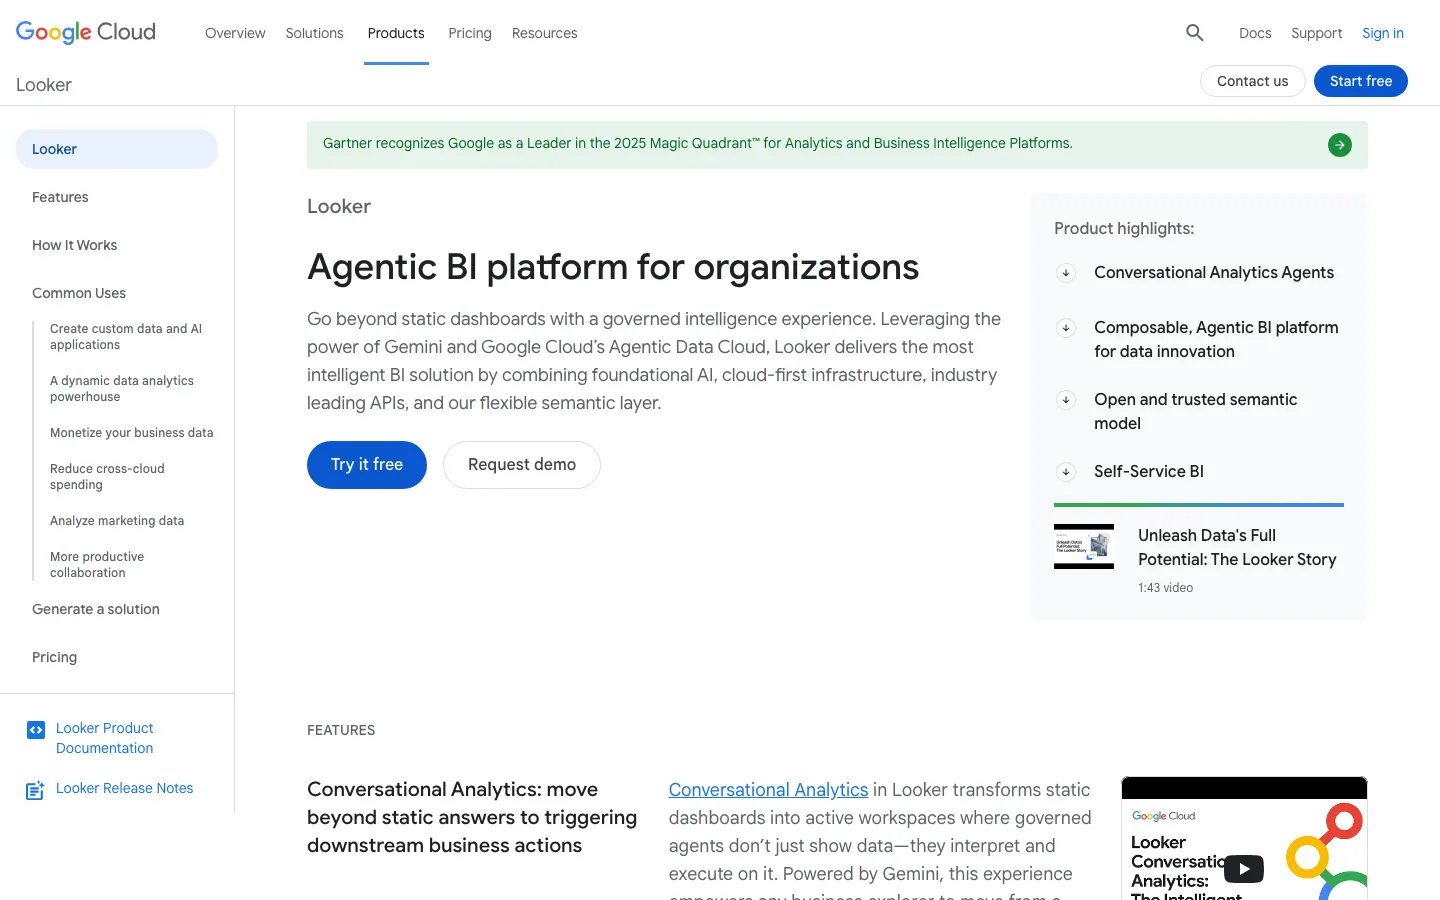
Screenshots of Looker (Google Cloud) 3 images
What's great
- LookML is the most mature semantic layer in commercial BI; when a CFO and a PM ask for "monthly recurring revenue," LookML makes sure they get the same number every time
- Tight integration with BigQuery, dbt, and Google Cloud makes the full data stack feel like one system for Google Cloud shops
- Embedded analytics via the Looker API is the strongest in this comparison; product teams ship customer-facing dashboards in weeks, not months
Watch-outs
- Standard edition starts around $66,600 per year for 10 Standard Users and 2 Developers; it is the most expensive entry point in this guide by a wide margin
- LookML has a learning curve that resembles learning a new programming language; data teams that adopt Looker typically need 6-8 weeks before analysts feel independent
- Google Cloud acquired Looker in 2020, and some analytics engineers report tension between LookML and dbt semantic layer definitions when both exist in the same stack
Looker is the right call when metric governance is a hard requirement, not a nice-to-have. 1,643 G2 reviews average 4.4/5, with analytics engineers consistently citing LookML as the differentiator.
Data teams that invest in LookML tend to keep Looker for years; the ones that skip proper LookML setup hit the same metric-drift problem Tableau shops have. Holistics.io’s Looker pricing breakdown puts the real starting cost at approximately $66,600 per year for the Standard edition.
The price is the honest filter. If your org can justify that spend, Looker delivers governance that nothing else in this list matches cleanly. If you can’t, Sigma or Metabase are faster paths to first value.
Pricing breakdown
| Plan | Price | Best for |
|---|---|---|
| Standard (10 Standard + 2 Dev users) | ~$66,600/yr | Teams under 50 users |
| Additional Standard User | $799/user/yr | Read-and-explore users |
| Additional Developer | $1,665/user/yr | LookML authors |
| Enterprise/Embed | Custom | 100+ users or embedded customer-facing analytics |
What reviewers say about Looker (Google Cloud)
Recurring themes across ~1,643 G2 reviews (4.4/5) plus Gartner Peer Insights and BI review roundups, 2024-2026.
What reviewers praise
- The LookML semantic layer is the defining strength reviewers cite: business logic and metric definitions live in version-controlled code, so everyone queries the same governed definitions and the multiple-versions-of-the-truth problem largely disappears.
- Deep integration with cloud warehouses, especially BigQuery, is praised for handling large data volumes well and keeping analysis close to the source.
- Once the model is built, business users get intuitive point-and-click exploration and self-serve reports without touching SQL, which reviewers value for reducing analyst bottlenecks.
- Dashboards are interactive and easy to share, and centralized governance and access controls make it a favorite of data teams that care about consistency and security.
- The governed, code-based modeling approach is repeatedly called a genuine differentiator from drag-and-drop BI tools for organizations that need metric consistency at scale.
What reviewers fault
- The LookML learning curve is the most repeated complaint: teams without SQL and modeling skills struggle, and reviewers note data requests still bottleneck with engineering because non-developers cannot self-serve model changes.
- Pricing is opaque and steep, all tiers are quote-only, and reported contracts routinely reach six figures a year, putting it out of reach for smaller teams.
- Visualization and charting feel dated and limited next to Tableau or Power BI, with reviewers wanting more chart types and formatting control.
- Query performance on complex analyses depends heavily on how the underlying warehouse is tuned, and users describe stakeholders left staring at loading spinners.
- Out-of-the-box AI and advanced-calculation features are thin, and reviewers note gaps in built-in calculations that force workarounds.
Loading reviews…
Sigma Computing
Best warehouse-native spreadsheet BI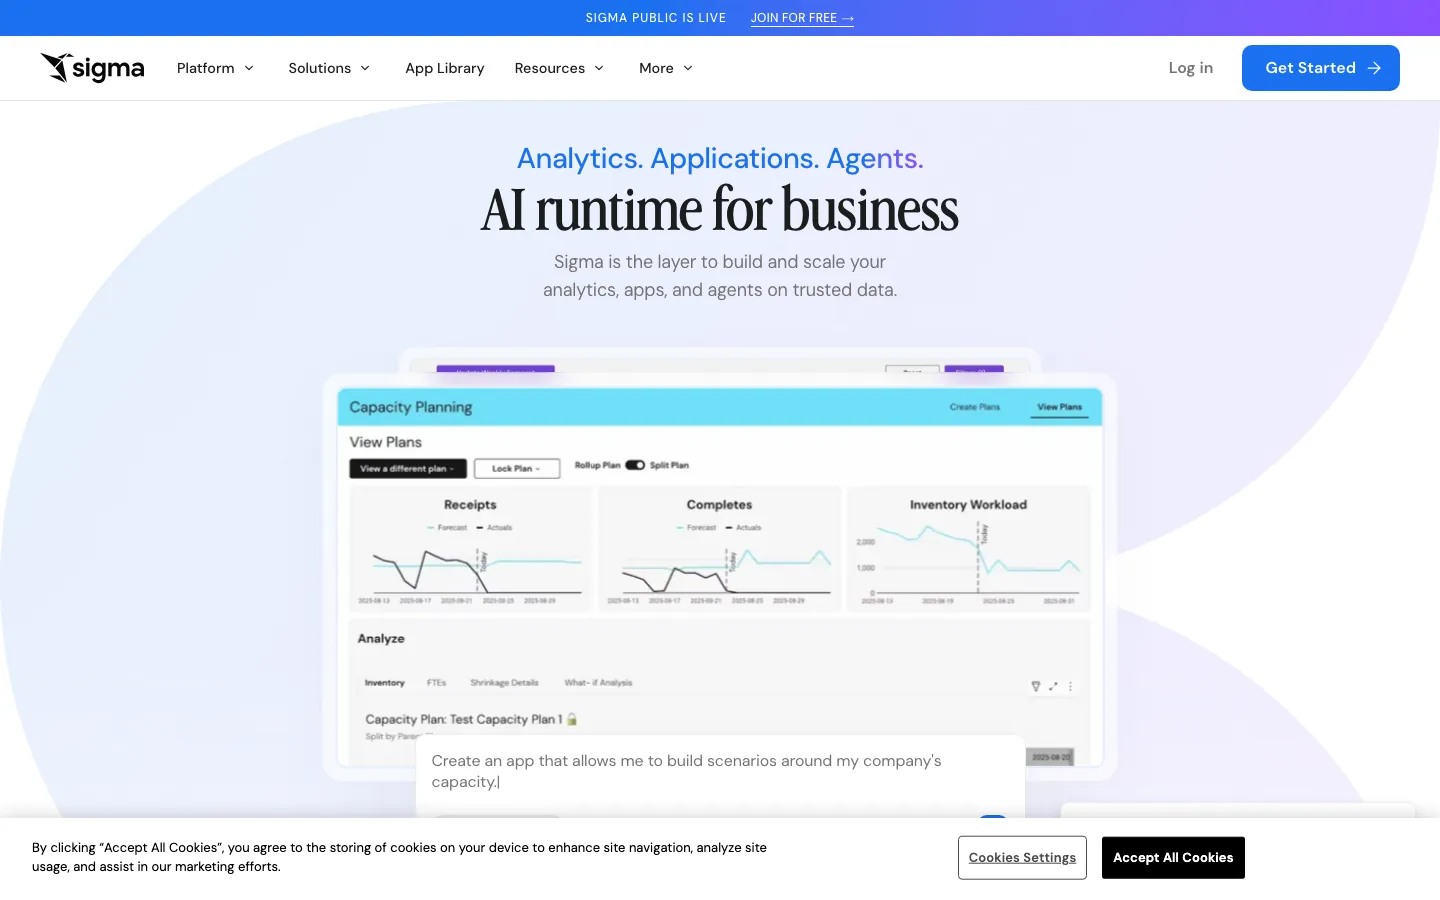
Screenshots of Sigma Computing 3 images
What's great
- Spreadsheet-native interface on live warehouse data; analysts who live in Excel or Google Sheets can explore Snowflake or BigQuery data without learning a new data model
- Push-down SQL means all computation runs in the warehouse, not in an extracted layer; no data duplication, no sync latency, no stale dashboards
- dbt integration is first-class; Sigma surfaces dbt-defined metrics directly in the workbook layer, closing the gap between transformation and exploration without manual reconciliation
Watch-outs
- Pricing is custom and negotiated; the median annual contract from 117 deals lands at $61,158 per Vendr data, which is enterprise territory for teams under 20 analysts
- The spreadsheet mental model that makes Sigma accessible to business users also confuses data engineers who expect a SQL editor with version control
- Embedded analytics and multi-tenant setups require Enterprise tier; the starting price conversation with sales is longer than for Metabase or Power BI
Sigma is what happens when you take a spreadsheet interface and attach it directly to a Snowflake or BigQuery table without extracting data. 557 G2 reviews average 4.4/5, with the consistent praise around the warehouse-native model and the consistent friction being the opaque pricing.
Sigma tends to work best at Series B and above, where the data team already runs dbt and wants to give the business team a governed exploration surface. Vendr’s Sigma pricing data shows median annual contracts at $61,158, ranging from $17,500 to $131,453.
If you’re on Snowflake or BigQuery and tired of explaining why the Tableau dashboard and the dbt model don’t match, Sigma is the answer.
Pricing breakdown
| Plan | Price | Best for |
|---|---|---|
| Core | Contact sales | Small analytics teams |
| Premium | Contact sales | Advanced modeling |
| Enterprise | Custom | 20+ users |
| Typical contract range | $17,500-$131,453/yr | Based on Vendr data from 117 contracts |
What reviewers say about Sigma Computing
Recurring themes across ~557 G2 reviews (4.4/5) plus Capterra and BI review roundups, 2024-2026.
What reviewers praise
- The spreadsheet-style interface is the standout: analysts who know Excel formulas and pivot tables are productive in Sigma without learning SQL, which reviewers call the main reason business users adopt it.
- It queries the cloud warehouse live with no extracts or scheduled refreshes, so users repeatedly praise always working against current data instead of stale snapshots.
- Warehouse connectivity, especially to Snowflake, is described as quick and painless to set up, with key-pair or OAuth handled cleanly.
- Low training overhead comes up often: because the paradigm is familiar spreadsheets, teams skip the weeks of onboarding other BI tools require.
- Governed self-service is valued, business users explore and build in a spreadsheet feel while data stays in the warehouse under IT's controls.
What reviewers fault
- Performance lags on complex workbooks are the most common gripe: heavy dashboards with many elements or big datasets get sluggish, and slow filter changes push some users to export to Excel.
- Because every action runs against the warehouse, reviewers warn that concurrent users filtering dashboards can spike Snowflake or BigQuery compute bills in ways that are hard to predict.
- Visualization customization is limited, users say pixel-perfect chart styling is more constrained than in Tableau or Power BI.
- Some advanced features are unintuitive and under-documented, leaving users to figure them out on their own.
- Version and access management draws complaints, it is hard to keep everyone on the same version of a document or know in advance who can view it.
Loading reviews…
Metabase
Best open-source self-serve for budget teams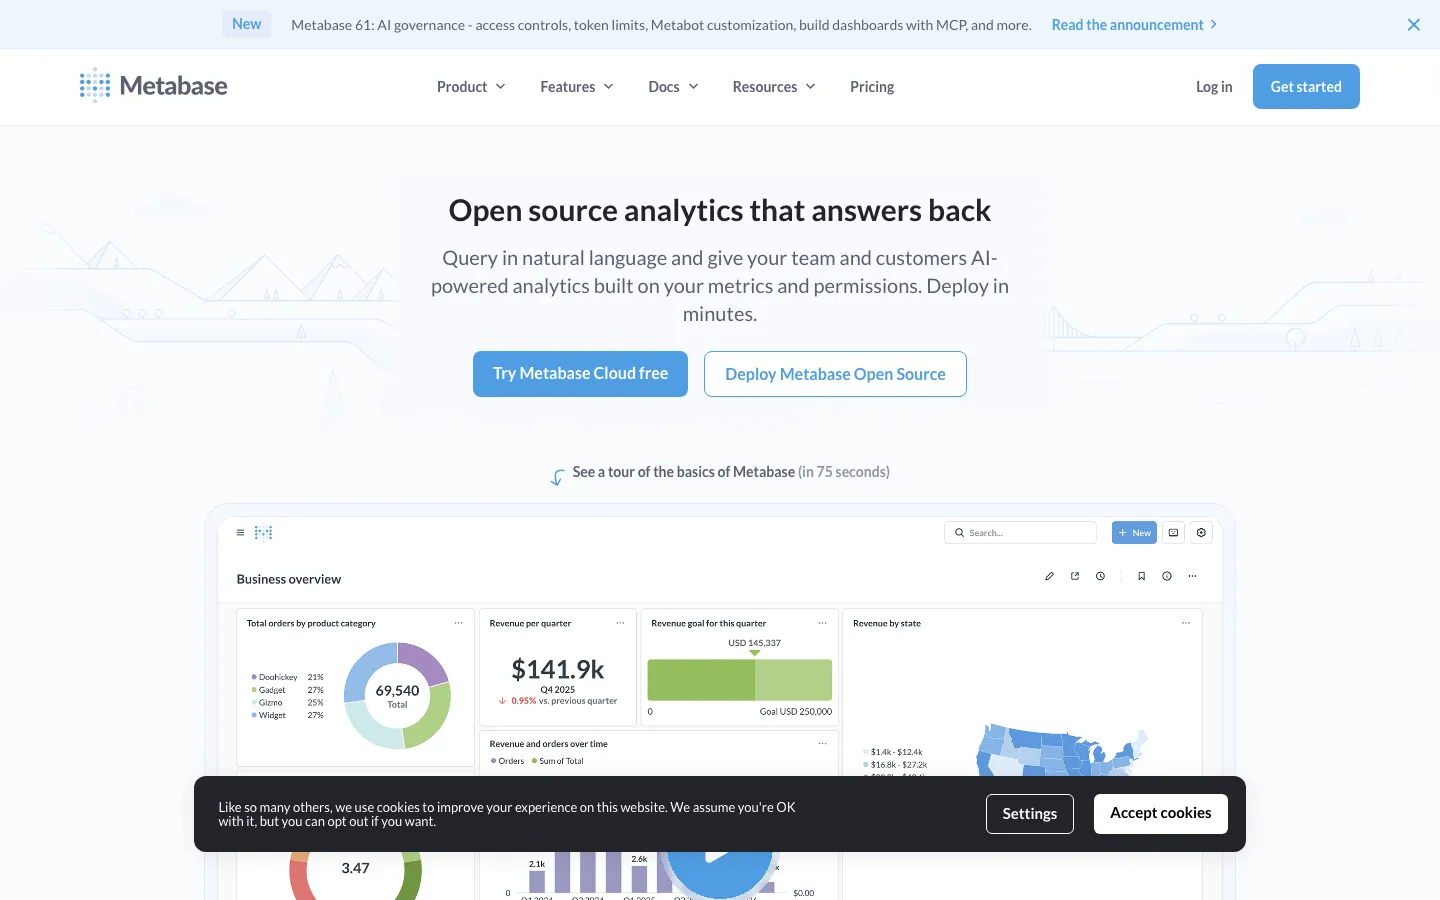
Screenshots of Metabase 3 images
What's great
- Free self-hosted tier with unlimited users and 20+ database connectors; the only tool in this guide that a three-person startup can deploy at $0 and ship actual dashboards by end of week
- Visual query builder lets non-technical teammates answer data questions without SQL; the UX is the cleanest no-code exploration layer in the open-source BI segment
- AI Copilot for SQL accelerates analyst work meaningfully and ships in the $100/mo Starter cloud plan, not as a $50/user add-on
Watch-outs
- No semantic layer; metric definitions live inside individual questions and dashboards, which means metric drift is a constant maintenance problem past 15-20 active users
- Performance degrades with large datasets and complex multi-join queries; teams on 100M+ row tables will hit slowdowns that push them toward a proper warehouse-native tool
- Limited pivot tables and frozen-column table functionality versus Tableau; analysts who need Excel-style reporting in a browser will hit walls
Pricing breakdown
| Plan | Price | Best for |
|---|---|---|
| Open Source | $0 | Self-hosted |
| Starter | $100/mo + $6/user/mo | 5 users included |
| Pro | $575/mo + $12/user/mo | 10 users included |
| Enterprise | $20 | 50+ users |
What reviewers say about Metabase
Recurring themes across ~146 G2 reviews (4.4/5) plus Capterra and open-source BI roundups, 2024-2026.
What reviewers praise
- Fast, simple setup is the most-cited strength, especially against Postgres, MySQL, and Snowflake, and the free open-source edition means teams get real BI running with little cost or friction.
- The no-code question builder lets non-technical users explore data, build charts, and assemble dashboards without writing SQL, which reviewers say democratizes reporting across a team.
- Scheduled reports and alerts delivered to email and Slack are a repeated favorite for keeping recurring metrics in front of stakeholders automatically.
- The clean, approachable interface gets praised for being genuinely usable without training, a contrast reviewers draw with heavier enterprise BI tools.
What reviewers fault
- Performance is the top complaint: large datasets, complex SQL, or heavily filtered dashboards slow down, with refresh times stretching into minutes on demanding queries.
- It lacks the depth of enterprise BI, reviewers note thin support for complex calculated fields, advanced data modeling, and row-level security without workarounds.
- Visualization and dashboard formatting are limited, with fewer chart types and less layout control than Tableau or Power BI.
- Governance for bigger teams is weak, users cite missing fine-grained access controls and permissions when rollouts grow beyond a small group.
Loading reviews…
Hex
Best for analyst-first collaborative notebooks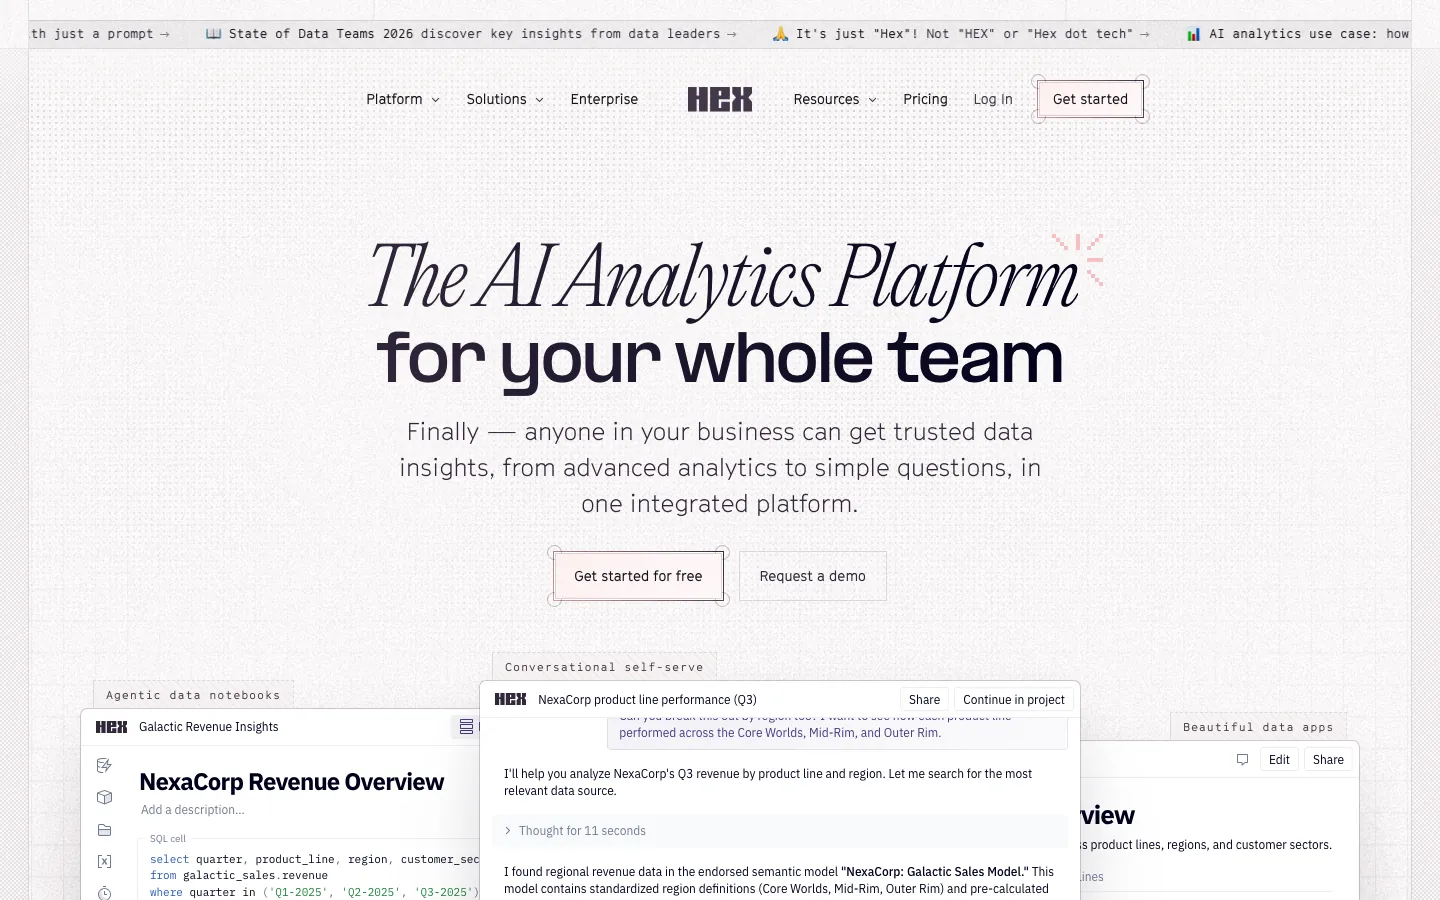
Screenshots of Hex 3 images
What's great
- SQL, Python, and R cells live in the same notebook; analysts write a SQL query, pass the result to a pandas transform, and drop it into a chart without switching tools or environments
- Semantic model agent in the Team tier understands your dbt models and can answer natural-language questions against them; the first credible AI layer built directly on a governed transformation layer
- Scheduled runs with screenshot-based alerts ship on the $75/editor/mo Team plan; Hex apps can replace a significant slice of operational dashboard infrastructure
Watch-outs
- Viewer experience is weaker than Tableau or Sigma; Hex apps are the right output format for analyst-built reports, but business users who want to self-serve on their own questions still hit a ceiling
- Community free tier caps editors at 5 notebooks; the $36/mo Professional tier removes limits but team collaboration features are $75/mo per editor, which adds up for larger analyst teams
- Smaller G2 review volume at 393 reviews versus Tableau's 3,653; the product is excellent but the ecosystem (community, Stack Overflow answers, third-party tutorials) is thinner
Hex is the tool analytics engineers reach for when they’re tired of choosing between a notebook (Python, version control, reproducibility) and a BI tool (sharing, scheduling, business-user friendly output). 393 G2 reviews average 4.5/5 with consistent praise for the multi-cell notebook workflow.
The Team plan at $75/editor/mo adds the semantic model agent that connects directly to dbt, making Hex the most dbt-native exploration surface in this guide. Hex’s published pricing puts the Team plan at $75/editor/mo with a 14-day free trial available.
Hex clicks best for 3-8 person analytics teams at Series A to C companies where the data team does serious Python work and also owns the business-facing dashboards. It is not the right pick if business users need to self-serve without analyst help.
Pricing breakdown
| Plan | Price | Best for |
|---|---|---|
| Community | $0 | Individual analysts |
| Professional | $36/editor/mo | Solo analysts |
| Team | $75/editor/mo | 2-10 analysts |
| Enterprise | Custom | 10+ editors |
What reviewers say about Hex
Recurring themes across ~393 G2 reviews (4.5/5) plus data-notebook review roundups, 2024-2026.
What reviewers praise
- Blending SQL and Python in one notebook is the headline strength: reviewers query data, transform it in Python, and hand results between cells without leaving the workspace.
- It collapses the usual toolchain, users say querying, analysis, and presentation live in one place instead of jumping between a SQL editor, a Jupyter notebook, and a separate BI dashboard tool.
- Collaboration features (shared projects, comments, version history) get repeated praise for making cross-functional and reproducible analysis easy.
- The reactive notebook feel is well-liked for fast ad hoc exploration, with reviewers comparing it favorably to a live, shareable Jupyter environment.
What reviewers fault
- The seat-plus-compute-minutes pricing is the most common frustration, reviewers say budgeting feels unpredictable and active teams get surprised by the monthly bill.
- Performance can lag on very large datasets or complex notebooks, particularly when many queries are chained together.
- Feature gaps come up around advanced libraries, limited R support, and raw computational power for heavier workloads.
- Some reviewers want stronger project-management and data-handling capabilities, noting limits on data size, filtering, and library compatibility.
Loading reviews…
Domo
Best for non-technical exec dashboards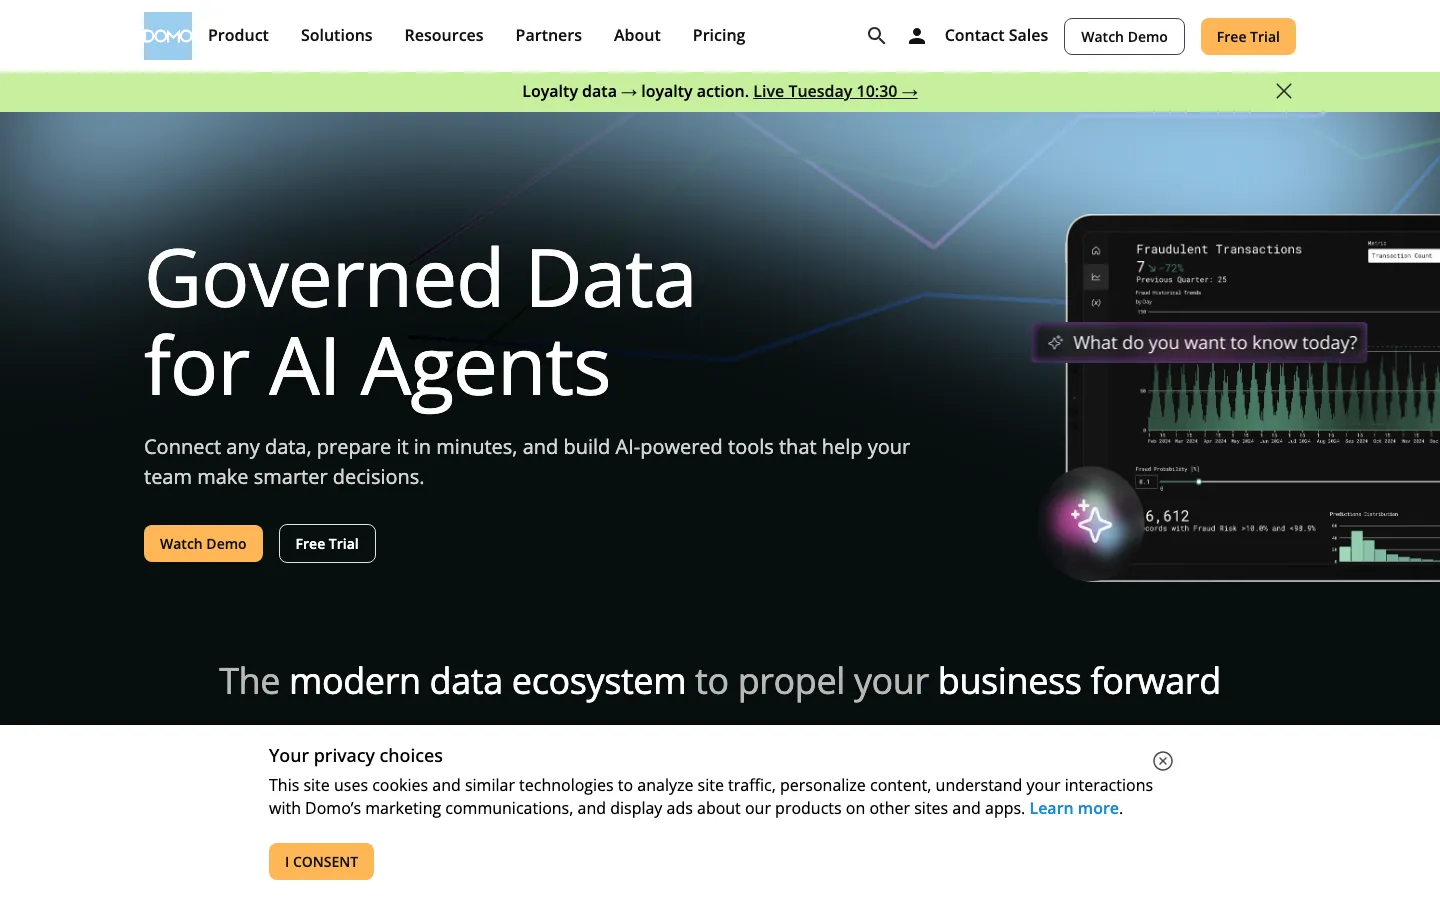
Screenshots of Domo 3 images
What's great
- 1,000+ pre-built connectors including Salesforce, NetSuite, Google Ads, and Shopify; non-technical ops and marketing teams get working dashboards without involving the data team at all
- Magic ETL (no-code data transformation) lets business analysts clean and join datasets without writing SQL; a genuine differentiator for orgs that lack dedicated data engineers
- Executive-facing card layout and mobile experience is the best in this guide; the Domo app is used in board meetings in a way that Tableau or Power BI dashboards rarely are
Watch-outs
- One verified G2 reviewer reported their renewal price increasing 1,120% with two months' notice, for the same user count and lower consumption than the prior year; the credit model is the most-cited source of contract regret in Domo reviews
- Proprietary data layer means data lives inside Domo's cloud rather than your warehouse; this creates vendor lock-in that is genuinely difficult to unwind
- Minimum contract around $30,000/year; small teams on $100K tooling budgets will find better ROI from Power BI or Metabase
Domo built its reputation on getting non-technical executives into data without a data engineering team. 1,005 G2 reviews average 4.3/5, with the consistent praise for ease-of-connection and the consistent fear around pricing unpredictability.
Toucantoco’s Domo pricing breakdown confirms the minimum $30,000/year starting point and the credit-consumption model that can produce surprising invoice spikes. Domo works best when the primary buyer is a VP of Operations or CFO who wants board-ready dashboards and is not on Snowflake yet.
If your data team is already warehouse-native, Domo’s proprietary layer adds overhead rather than removing it.
Pricing breakdown
| Plan | Price | Best for |
|---|---|---|
| Standard | Contact sales | 10-25 users |
| Enterprise | Contact sales | 25-200 users |
| Business Critical | Contact sales | 200+ users |
| Typical range (Vendr) | $30K-$150K/yr | Based on user count and consumption tier |
What reviewers say about Domo
Recurring themes across ~1,005 G2 reviews (4.3/5) plus Capterra and pricing-analysis roundups, 2024-2026.
What reviewers praise
- Magic ETL is the most-praised feature: reviewers build and maintain data pipelines visually, without heavy coding, and treat it as the core of how they wrangle data inside Domo.
- Breadth of connectors stands out, with 1,000-plus integrations across CRMs, marketing apps, ERPs, and cloud databases pulling everything into one place.
- Dashboards and cards are called visually appealing and easy to assemble, and non-technical users report getting to insights quickly.
- Consolidating many sources into a single real-time view is repeatedly cited as the reason teams chose Domo for executive and operational monitoring.
- The all-in-one nature, ingestion, transformation, visualization, and distribution in one platform, is valued by teams that want to avoid stitching tools together.
What reviewers fault
- The consumption-credit pricing model is the dominant complaint: nearly every action (ingesting data, running Magic ETL, refreshing dashboards) burns credits, so the more insights you generate the higher the bill, and Magic ETL charging on both input and output effectively double-counts.
- Cost unpredictability compounds it, reviewers report there is no hard credit cap, overages accumulate silently, and renewal pricing has jumped dramatically with little notice.
- Overall cost is high versus other BI tools, which reviewers say makes it hard to justify for smaller teams.
- Visualization flexibility is limited, the chart and card options feel narrow next to modern BI competitors.
- Newer features, especially Domo Apps and some AI tools, are described as shipped before they are ready, and the learning curve for the full platform is steep.
Loading reviews…
Sisense
Best for embedded customer-facing analytics
Screenshots of Sisense 3 images
What's great
- Embedded-first architecture with iFrame, SDK, and Sisense.js options; SaaS product teams can ship white-labeled customer-facing dashboards without building a custom viz layer from scratch
- Multi-tenant data segregation is native; the platform is architected for the use case where 500 customers each see only their data slice, which is the hardest problem in embedded BI
- Elasticube in-memory engine handles joins and aggregations in a cached layer, which helps for complex multi-source data models where query speed matters for customer-facing experience
Watch-outs
- The implementation effort is real; Gartner Peer Insights reviewers consistently cite 3-6 month implementation timelines and steep admin overhead once deployed
- Pricing starts around $25,000/year and scales with data volume and embed usage; not a tool you trial at $200/mo and decide to buy next month
- The general-purpose internal BI experience is weaker than Tableau or Sigma; Sisense is an embedded-analytics specialist, not an all-purpose BI platform
Pricing breakdown
| Plan | Price | Best for |
|---|---|---|
| Standard (SaaS) | Contact sales | Internal BI |
| Embedded Starter | ~$25,000/yr | SaaS products with under 500 customer-facing embed users |
| Embedded Scale | ~$60,000+/yr | 500-5 |
| Enterprise | Custom | 5 |
What reviewers say about Sisense
Recurring themes across ~1,062 G2 reviews (4.2/5) plus Capterra and embedded-analytics roundups, 2024-2026.
What reviewers praise
- The Elasticube engine is the most-cited strength, reviewers say it processes and scales large datasets fast, which is the reason many chose Sisense over lighter BI tools.
- Embedded analytics is a repeated highlight: teams white-label and drop dashboards directly into their own products using iframes, SDKs, or Sisense.JS.
- Dashboard design and visualization draw praise, users describe good widgets, varied chart types, and clear KPI and metric views that are easy for stakeholders to read.
- Customer support is frequently singled out as responsive and effective at resolving issues during and after implementation.
What reviewers fault
- Pricing is opaque and expensive, reviewers call it secretive, note hidden fees for plugins, connectors, upgrades, and AI features, and say charging by both cube and user makes budgeting hard.
- The learning curve is steep and Elasticube is hard to build, reviewers say the average user cannot create one without technical help and often ends up writing SQL despite the codeless-reporting pitch.
- Feature gaps and weak, outdated documentation come up often, with users citing missing capabilities and broken or stale help links that complicate real work.
- Stability issues are reported, including bugs in the database cache that surface incomplete data and interrupt operations.
- The reliance on technical expertise means Sisense is described as less user-friendly than competing analytics platforms for non-developers.
Loading reviews…
ThoughtSpot
Best natural-language search BI
Screenshots of ThoughtSpot 3 images
What's great
- Natural-language search lets non-technical executives type a question and get a correct chart in under 10 seconds; the search-led analytics model is genuinely different from dashboard-first tools
- Spotter AI Agent ships on the Pro tier at $50/user/mo and handles multi-step ad-hoc analysis via conversational prompts, the first AI analytics agent in this guide that works on real enterprise-scale data
- Supports up to 250 million rows in live query mode; the architecture handles the kind of ad-hoc questions that break dashboard-first tools
Watch-outs
- Auto-generated charts are basic; when the search answer is correct the visualization is often not good enough for board-level presentations without additional polish
- Requires a structured semantic model to work well; teams that buy ThoughtSpot without a well-maintained data model get incorrect or confusing natural-language answers
- $50/user/mo Pro tier for the full AI functionality is steep relative to Power BI at $14; a 20-person org on Pro runs $12,000/yr before any implementation cost
Pricing breakdown
| Plan | Price | Best for |
|---|---|---|
| Essentials | $25/user/mo | Teams up to 25 users |
| Pro | $50/user/mo | 25-1 |
| Enterprise | Custom | 1 |
| Embedded Analytics | Custom | Customer-facing ThoughtSpot embed |
What reviewers say about ThoughtSpot
Recurring themes across ~330 G2 reviews (4.4/5) plus Capterra and BI review roundups, 2024-2026.
What reviewers praise
- Natural-language search is the defining strength: reviewers type questions in plain English and get answers, and cite the AI-driven search as what lets non-technical staff self-serve without building queries.
- Ease of use scores highly, users repeatedly call the interface intuitive and say business people generate insights and dashboards with little training.
- Genuine self-service is a recurring theme, most reviewers say it frees them from waiting on an analyst to run a report.
- Customer support is praised as strong, making implementation and troubleshooting fast and low-hassle.
- The AI and search layer is seen as a real differentiator from traditional drag-and-drop BI, especially for organizations pushing analytics to a broad audience.
What reviewers fault
- Visualization and customization are limited, reviewers cite fewer chart types, less styling control, and weaker dashboard-design flexibility than Tableau or Power BI.
- The learning curve is steeper than expected for teams coming from traditional BI, which dents early adoption despite the search-first pitch.
- Persistent bugs frustrate users, who say fixes take too long and disrupt day-to-day use.
- Consumption-based pricing (per query and per dashboard load) makes costs hard to predict, and reviewers say it runs expensive for mid-market budgets.
- Performance complaints appear around slow load times, especially for dashboards served to end customers in embedded scenarios.
Loading reviews…
Tools we considered but excluded
We evaluated more tools than the 9 you see above. These did not make the cut. Saying what we rejected, and why, is the editorial muscle most listicles skip.
- Qlik Sense: Strong associative data model for complex non-star-schema data but UX is a generation behind modern tools and the per-user pricing is less competitive than Sigma or Power BI at comparable feature depth
- MicroStrategy: Mostly on-premise enterprise deployments with IT-led implementation; cloud story is improving but not a comparable buy for the majority of readers in 2026
- Looker Studio (Google): Free and useful for marketing dashboards but not a serious governed BI platform; no semantic layer, no enterprise access controls, limited data modeling
- Amazon QuickSight: Good value inside AWS but the UX and visualization flexibility trail Tableau and Power BI; the correct pick for AWS-native shops, not a general-purpose recommendation
- Mode Analytics: Acquired by ThoughtSpot in 2023 and being folded into the ThoughtSpot platform; buying Mode as a standalone product today carries roadmap uncertainty
- Holistics: Strong semantic layer and dbt integration for Southeast Asia-based teams, limited US enterprise footprint and smaller review corpus than tools we tested
Honorable mentions
Solid tools that did not crack the main list but are worth tracking, especially for niche use cases.
- Omni Analytics: The most dbt-native BI tool in 2026 with a clean semantic layer that lives alongside dbt models; worth tracking as the Looker-alternative for Google Cloud defectors
- Apache Superset: The open-source alternative to Metabase for teams that want more SQL control and can staff the DevOps overhead; Preset.io is the managed SaaS version worth evaluating
- GoodData: Headless BI approach with a strong API and multi-tenant semantic layer; the right pick for SaaS companies building embedded analytics where Sisense's price is a hard stop
The four architectures behind every BI tool
The BI software market in 2026 is split across four fundamentally different architectures that get lumped under the same “business intelligence” label. Picking the wrong one means spending six months on a tool that works technically but fails organizationally.
Legacy governed BI. Tableau, Power BI, Looker. These are the tools that Fortune 500 IT departments standardized on between 2010 and 2020. They have the deepest visualization libraries, the most complete security and SSO implementations, and the most integrations. They also have the steepest onboarding curves and the most complex licensing models.
Warehouse-native and cloud-first BI. Sigma Computing, Hex. Built in the 2017-2022 era when Snowflake and BigQuery became the defaults. These tools push all computation back into the warehouse rather than extracting and caching data in a proprietary layer. If your data team is already running dbt, these tools feel like a native extension of the stack.
Open-source and budget BI. Metabase, Apache Superset. The tools that get teams from “we have data in Postgres” to “the business team can answer questions” without procurement cycles or contract negotiations. Ceiling is lower, but the floor is faster.
Self-serve and embedded analytics. Domo, Sisense, ThoughtSpot. Domo optimizes for non-technical business users who want dashboards without touching SQL. Sisense and Looker Embed optimize for SaaS companies shipping analytics inside their own product. ThoughtSpot optimizes for ad-hoc question-asking via natural language search.
All nine tools in this guide cover at least two of these buckets. The right pick depends on which bucket matches your primary problem.
What’s changing in BI software in 2026
The dbt semantic layer is becoming the governance standard. Through 2024, every BI tool had its own semantic layer story. LookML for Looker, YAML models for Power BI, workbook calculations for Tableau. In 2026, dbt’s standalone Semantic Layer has become the coordination point.
Sigma, Hex, and Omni all surface dbt-defined metrics natively without requiring a parallel modeling effort. This is a meaningful shift: data teams can now define a metric once in dbt and expose it to multiple BI tools without divergence.
Power BI raised prices for the first time in a decade. Microsoft increased Pro from $10 to $14 and Premium Per User from $20 to $24 in April 2025. These were the first meaningful price increases since the product launched. The net effect is that the Power BI cost advantage over Tableau narrowed at the Creator-equivalent tier. Microsoft 365 E5 bundles still include Pro at no incremental cost, so the pricing hit lands hardest on orgs buying Power BI standalone.
Tableau’s Salesforce integration is finally delivering. Two years after Salesforce acquired Tableau, the CRM-to-analytics story is working. Salesforce Data Cloud pipelines feed directly into Tableau without a warehouse hop. For Salesforce-heavy orgs, this changes the total cost math because a dedicated Salesforce analytics layer (CRMA, previously Einstein Analytics) is no longer necessary.
AI analytics went from demo to deployment. ThoughtSpot’s Spotter agent, Hex’s semantic model agent, and Sigma’s AI exploration features all shipped production-grade in H1 2026. The previous generation of BI AI was chart summarization (Tableau Explain Data, Power BI Q&A). The 2026 generation is warehouse-grounded conversational analysis that returns SQL, not prose.
These are BI-native features bolted onto dashboard tools; the standalone products built purely around conversational and automated analysis get their own treatment in our roundup of AI tools for data analytics .
Embedded analytics became a product category of its own. Sisense, Looker Embed, and GoodData are competing for SaaS companies building customer-facing analytics. The category is large enough that tools with no embedded story are explicitly out of consideration for that buyer type.
Selection criteria, what to test in your BI trial
The BI trials that end in successful rollouts tend to follow a consistent pattern. Eight specific things to test before signing.
One, load your real warehouse, not demo data. Take 3 months of actual production data from your warehouse and build your core metrics against it during the trial. Every BI tool looks good against the vendor’s sample dataset. The failure modes show up when you run your own messy, multi-join production schema. Plan for 4 hours on this step for Metabase and Power BI; plan for a full day for Looker and Sigma.
Two, time the click-count from question to chart. Take a real business question (“what was CAC by channel last quarter?”) and measure how many steps it takes to get a correct answer. The difference between a good and a great BI tool in this test is often 4 steps versus 12. At 100 questions per week across an analytics team, that’s real analyst hours.
Three, run a metric consistency test. Have three analysts independently build “monthly recurring revenue” in the tool. Then compare the outputs. If they match, the semantic layer is working or the team has strong naming conventions. If they don’t, you’ve found your future metric-drift problem before the contract is signed. Looker and Sigma with dbt integration tend to pass this test most reliably.
Four, export the full dataset. Pull every dashboard, data model, and underlying query into a portable format. This is the BI equivalent of the CRM data-ownership test. If the export requires a support ticket or produces a proprietary format nobody else can read, you’re building future lock-in. Tableau, Power BI, and Metabase all pass this cleanly. Domo is the most friction-heavy.
Five, test the permission model end-to-end. Create a row-level security policy that restricts a sales manager to their region’s data only. Then verify it holds. The BI tools that advertise row-level security but implement it as a dashboard filter rather than a warehouse-level policy will pass the demo and fail the security review.
Six, run the integration your stack actually needs. If you run Salesforce, test the Salesforce connector end-to-end, not the demo dataset. If you run dbt, test whether the tool surfaces dbt models natively or requires a manual re-import. The “500+ integrations” claim in every vendor’s deck is always true in aggregate; the question is whether the three integrations your stack actually needs work cleanly without a Zapier workaround.
Seven, ask about the semantic layer architecture in writing. Specifically: where do metric definitions live, how are they versioned, and what happens when the same metric is defined differently in two places? The tools with strong semantic layers (Looker, Sigma with dbt, Hex Team) have clear, enforceable answers. The tools without one (Metabase, early-stage Tableau deployments) will give you a workflow answer that’s really just “your team’s naming conventions.”
Eight, call three customers in your size band independently. Not the vendor’s reference list. Find Sigma or Tableau users on LinkedIn in your industry and ask the unfiltered question: did the tool produce what you expected? The answer tells you more than any G2 review.
Where the nine BI tools differ on semantic layer and SQL
| Tool | Semantic Layer | SQL Passthrough | dbt Native | Free/Open Source | Embedded Analytics |
|---|---|---|---|---|---|
| Tableau | • limited | ✗ | $ add-on | ✗ trial only | $ add-on |
| Power BI | • DAX models | ✗ | • via connector | ✓ free tier | $ Fabric |
| Looker | ✓ LookML | ✓ | ✓ | ✗ | ✓ Embed tier |
| Sigma | ✓ via dbt | ✓ push-down | ✓ | ✗ | Enterprise |
| Metabase | ✗ | ✓ SQL editor | • manual | ✓ self-hosted | Pro+ |
| Hex | ✓ via dbt | ✓ SQL cells | ✓ | ✓ community | Enterprise |
| Domo | • proprietary | ✗ | ✗ | ✗ | Enterprise |
| Sisense | • partial | ✓ | ✗ | ✗ | ✓ core feature |
| ThoughtSpot | ✓ required | ✓ | ✓ | ✗ | ✓ Embed tier |
The biggest fault lines: Looker, Sigma, Hex, and ThoughtSpot are semantic-layer-native tools. Tableau and Domo treat metric definitions as a team discipline problem, not a platform one. Metabase has no semantic layer and builds the SQL access depth that makes it the fastest to first result.
BI security and compliance, tier by tier
| Tool | SOC 2 Type II | GDPR | HIPAA | SSO/SAML | Row-Level Security |
|---|---|---|---|---|---|
| Tableau | ✓ | ✓ | ✓ | ✓ all tiers | ✓ |
| Power BI | ✓ | ✓ | ✓ | ✓ all tiers | ✓ |
| Looker | ✓ | ✓ | ✓ | ✓ all tiers | ✓ LookML |
| Sigma | ✓ | ✓ | Enterprise | Enterprise | ✓ |
| Metabase | ✓ cloud | ✓ | ✗ SaaS | Pro+ | ✓ Pro+ |
| Hex | ✓ | ✓ | Enterprise | Enterprise | Enterprise |
| Domo | ✓ | ✓ | ✓ Biz Critical | ✓ | ✓ |
| Sisense | ✓ | ✓ | ✓ Enterprise | ✓ | ✓ |
| ThoughtSpot | ✓ | ✓ | ✓ | ✓ all tiers | ✓ |
For enterprise IT reviews, every tool in this guide has SOC 2 Type II on at least the top two paid tiers. HIPAA is available on Domo’s Business Critical, Sisense Enterprise, ThoughtSpot Enterprise, and Metabase’s self-hosted deployment with proper configuration.
The biggest gap is Metabase cloud (no HIPAA support on the SaaS version), which matters for healthcare-adjacent analytics teams.
SQL access depth
This section is what most BI comparison guides skip, and it is the single biggest differentiator between tools in day-to-day analyst experience.
Full SQL passthrough (analysts write raw SQL, results go to viz). Metabase, Hex, Looker, Sigma, ThoughtSpot. These tools let analysts write SQL against the warehouse and route the results into any visualization. This is table stakes for modern data teams who came up writing SQL and don’t want to learn a proprietary query language.
SQL-behind-glass (SQL is generated but not editable by analysts). Tableau, Power BI, Domo. These tools abstract SQL behind a drag-and-drop interface. Analysts can see the generated query in some cases but can’t freely edit it. The benefit is lower barrier for business users; the cost is that advanced analysts hit walls when they need complex window functions, lateral joins, or CTEs.
Proprietary query language required. Tableau uses calculated fields and LOD expressions. Power BI uses DAX. Looker uses LookML. Each is powerful in its domain and each has a learning curve that takes 4-8 weeks to build real competence. Hiring an analyst who knows LookML well costs $15-20K more per year in a competitive market.
Push-down vs extract. Sigma, Looker, ThoughtSpot, and Hex all run SQL queries against the live warehouse at query time. Tableau and Power BI (in non-DirectQuery mode) extract data into an in-memory layer first. Push-down is better for data freshness and avoids duplication; extract is better for query performance on large joined datasets where the warehouse is slow. Most modern warehouse-native teams default to push-down.
SQL access depth on self-serve tools. The tools that hide SQL from business users (Domo, Power BI without DirectQuery, Tableau without SQL passthrough) make the business-user experience cleaner but create a two-class system where analysts have power and business users don’t. ThoughtSpot is the most credible attempt to solve this: the natural-language query generates correct SQL without the business user ever seeing it.
Semantic layer story
The semantic layer problem sounds technical but is really a trust problem. When the finance dashboard shows $4.2M ARR and the revenue dashboard shows $4.8M ARR, the business team stops trusting data. Both numbers are technically correct using different metric definitions. The semantic layer is what prevents that scenario.
LookML (Looker). The most mature semantic layer in commercial BI. Every metric, dimension, and join is defined once in version-controlled code. When the definition changes, every dashboard that uses it updates automatically. The trade-off is that LookML is a domain-specific language that takes 4-8 weeks to learn and requires analytics engineers rather than business analysts to maintain.
dbt Semantic Layer (Sigma, Hex, Omni, GoodData). dbt defines metrics in YAML as part of the transformation workflow. BI tools that read dbt’s semantic layer get metric definitions for free, without rebuilding them in the BI tool itself. This is the architecture most analytics engineering teams in 2026 are building toward. If your team runs dbt, this approach requires no additional governance overhead.
Proprietary model (Power BI DAX, Tableau Data Model). Both tools have modeling layers but they live inside the BI tool, not in a version-controlled file that other tools can read. A Power BI dataset can be used as a “semantic model” inside Power BI, but not exposed to Sigma or Hex. This creates silos when teams use multiple BI tools.
No semantic layer (Metabase, Domo). Metric definitions live inside individual questions and dashboards. This is fine at small scale; it becomes a maintenance problem past 20 active users. Every team on Metabase past 50 users has a “the real X dashboard” problem where there are three competing dashboards for monthly revenue and nobody knows which one to trust.
The 2026 consensus in the analytics engineering community is clear: define metrics in dbt, expose them to BI via the dbt Semantic Layer, and pick a BI tool that natively reads that layer. Sigma, Hex, and Omni are the tools best positioned for that architecture.
Integration depth across the BI stack
| Tool | Snowflake | BigQuery | dbt | Slack alerts | Salesforce |
|---|---|---|---|---|---|
| Tableau | N | N | $ add-on | N | N (native) |
| Power BI | N | N | • connector | N | • connector |
| Looker | N | N (GCP) | N | N | N |
| Sigma | N | N | N (first-class) | N | • connector |
| Metabase | N | N | • manual | • | • connector |
| Hex | N | N | N (first-class) | N | • connector |
| Domo | N | N | ✗ | N | N |
| Sisense | N | N | ✗ | N | N |
| ThoughtSpot | N | N | N | N | N |
Looker and Sigma have the deepest warehouse-native stories for Snowflake and BigQuery. Looker’s BigQuery integration is first-party (both are Google Cloud products). Sigma’s Snowflake integration is first-party. Tableau and Power BI connect natively to both but via ODBC/JDBC rather than a deeply co-engineered layer.
Domo and Sisense are the weakest on dbt integration, which matters increasingly as dbt becomes the default transformation standard for US mid-market data teams.
Picking the right BI tool for your team
Five questions. Answer them honestly and the shortlist goes from nine tools to two or three.
1. Whether your data team already runs dbt
If yes, Sigma, Hex, or Looker. These tools read dbt-defined metrics natively and save your analytics engineers from building a parallel semantic layer. If no, Power BI and Tableau are still valid picks, but plan for metric drift to become a problem in 18-24 months as the team grows.
2. The primary consumer of your dashboards
Business users who want pre-built answers: Tableau, Power BI, Domo. Business users who want to ask their own questions: ThoughtSpot. Analysts who build and share: Hex. Mixed-audience organizations: Sigma (read-like-a-spreadsheet for business users, SQL for analysts).
3. Shipping analytics inside your own product
If yes, Sisense, Looker Embed, or ThoughtSpot Embedded. Every other tool in this guide is built for internal analytics, and using them for customer-facing embed is a significant architectural workaround.
4. The actual year-1 budget
- Under $10K. Metabase self-hosted at $0 or Metabase cloud at $100-$575/mo. Nothing else belongs in this budget.
- $10K-$50K. Power BI Pro for Microsoft shops, Tableau Standard for mixed stacks, Sigma or Hex at entry-level.
- $50K-$150K. Looker Standard, Sigma Enterprise, Tableau Enterprise, ThoughtSpot Pro.
- $150K+. Looker Enterprise, Salesforce Tableau Enterprise with Data Cloud, Domo Enterprise, Sisense embedded at scale.
5. Your team’s SQL confidence
Analyst-heavy team (everyone writes SQL): Hex or Metabase, where SQL is the primary interface. Mixed team (some SQL, some not): Sigma or Tableau, which accommodate both. Business-user-led (no SQL expectation): Domo, Power BI, or ThoughtSpot, which hide SQL entirely.
How to roll out BI without breaking the metric trust you have now
Most BI rollouts fail not because the platform is wrong, but because the existing “source of truth” dashboards (Excel, Sheets, or the old BI tool) are never formally deprecated.
Phase 1 (weeks 1-2): Configuration on one domain. Pick one business domain: revenue, product, or marketing. Build the five most-referenced reports in that domain against your real warehouse data. Have three stakeholders validate the numbers against their existing source. Get explicit sign-off that the new tool is correct before expanding.
Phase 2 (weeks 3-4): Pilot with the primary analytics team. Run all new requests through the new tool only. Don’t run both tools in parallel for new work. Parallelism creates the metric-drift problem in your new tool before it’s even adopted.
Phase 3 (weeks 5-8): Expand to business stakeholders in that domain. Train each business user in a 30-minute session on the two or three views they’ll use regularly. Build a Loom walkthrough for the five most common tasks. Don’t send a documentation wiki; no one reads it.
Phase 4 (weeks 9-12): Formally deprecate the old source. Export historical data from the old tool. Archive it read-only. Then close it. Teams that keep the old tool “just in case” end up back at metric drift within three months. The hard deprecation is the move.
What BI software really costs in year one
What vendor pricing pages say vs what teams actually pay (year-1 estimates based on vendor pricing, published benchmarks, and typical implementation costs, May 2026):
| Deployment type | Listed price | Real year-1 cost |
|---|---|---|
| Metabase cloud (10-person startup) | $100-$575/mo | $1,200-$7,000 |
| Power BI Pro (30-person org, M365) | $14/user/mo | $0 incremental (bundled) |
| Tableau Standard (20-person team, 5 Creators) | $5,160/mo | $72,000+ (onboarding + training) |
| Sigma (Series B, 15-analyst team) | Contact sales | $40,000-$80,000 |
| Looker Standard (10 users, 2 developers) | ~$66,600/yr | $90,000-$130,000 (implementation + LookML dev) |
| Domo (30-user org) | Contact sales | $55,000-$90,000 (including implementation) |
| ThoughtSpot Pro (20 users) | $50/user/mo | $18,000-$24,000 |
| Sisense Embedded (500 embed users) | ~$60,000/yr | $80,000-$120,000 (including SDK setup) |
The single biggest forecast error: teams buy Tableau for $15/Viewer/mo, realize the team needs Creator seats to build, upgrade 6 creators to $75/user/mo, and hit a $4,500/mo line item nobody planned for. Lock in Creator-to-Viewer ratios before signing the first contract.
Notice how the implementation line dwarfs the license on Looker, Sigma, and Domo. Teams without a spare analytics engineer to build the semantic layer often bring in one of the analytics consulting firms we track to stand up the first models, then hand the maintenance back in-house once the metric definitions are stable.
The BI pick by company stage
- Pre-seed and seed, under 10 analysts: Metabase self-hosted at $0. No other tool competes on cost-to-first-dashboard at this stage.
- Seed to Series A, 5-20 person company, Microsoft 365 shop: Power BI Pro at $14/user/mo. The Excel familiarity and Teams integration reduces training time to near zero.
- Seed to Series A, 5-20 person company, non-Microsoft stack: Metabase cloud Starter at $100/mo or Hex Professional at $36/editor/mo if the team writes Python or SQL regularly.
- Series A to B, 20-80 person company, dbt already running: Sigma or Hex Team. Both surface dbt metrics natively and skip the metric-drift problem other tools create.
- Series A to B, 20-80 person company, no dbt yet: Tableau Standard (if visualization depth matters) or Power BI Pro (if cost is the constraint).
- Series B to C, 80-300 person company, metric governance required: Looker. The LookML investment pays back when you have 30+ people asking questions about the same metrics simultaneously.
- Series C+, 300+ person company, Google Cloud stack: Looker Enterprise. The BigQuery co-engineering makes the integration costs the lowest in the segment.
- Enterprise, mixed stack, Salesforce-heavy: Tableau Enterprise with Salesforce Data Cloud integration. The connector story works now.
- SaaS company building customer-facing dashboards: Sisense Embedded or Looker Embed. No other tool in this guide is architected for multi-tenant customer-facing analytics at scale.
- Organization where execs want ad-hoc answers: ThoughtSpot Pro with the Spotter AI Agent. It is the only tool in this guide where a non-technical executive can type a question and get a correct chart without a data analyst in the loop.
For corrections, vendor pricing disputes, or data points from your own deployment, email hello@topickz.com . We re-verify the full BI shortlist every six months; the next refresh ships in November 2026.
Frequently asked questions
How much should BI software actually cost per user in 2026?
Viewers land $10-$15/user/mo. Creators run $42-$115/user/mo. Enterprise contracts start $30K+/yr. Year-1 all-in is 1.5-2x sticker once implementation lands.
Do we need a data warehouse before buying BI?
Yes. Direct-to-database BI slows production and produces inconsistent dashboards. Snowflake, BigQuery, or Redshift pays back within 90 days at 20+ users.
Tableau vs Power BI in 2026, which one wins?
Microsoft shops, Power BI wins at $14/user. Mixed stacks, Tableau wins on viz. DAX reporting favors Power BI. Self-serve exploration favors Tableau.
What is a semantic layer and why does it matter?
A single governed definition of metrics shared across all dashboards. Without it, analysts build competing formulas and dashboards disagree at board meetings.
Is Metabase good enough for a real company?
Yes, up to 20-30 active users. Past that, metric drift becomes a management problem. Self-hosted at $0 is the best BI value at seed stage.
What BI tool works best with dbt in 2026?
Sigma for warehouse-native, Hex for analytics-engineer teams, Looker for LookML governance. All three read dbt metrics natively without reconciliation.
How long does BI implementation actually take?
First dashboards in 1-4 weeks. Organization-wide metric trust takes 6-12 months. Teams underestimate the change-management cost, not the technical rollout.
What is the biggest hidden cost in BI contracts?
Domo's credit-model spikes and Tableau's Creator seat creep hit hardest. Looker's LookML dev time (6-8 weeks) is the hidden implementation cost nobody budgets.
Can a non-technical business user actually self-serve in BI tools?
In Power BI and Tableau, yes for pre-built dashboards. For ad-hoc questions, only ThoughtSpot's search handles non-SQL self-serve reliably at scale.
When should we migrate off Metabase?
Three signals, dashboards disagree on the same number, analysts rebuild the same metric twice, data team spends more time on admin than analysis.
Related helpful reads
Write a review
Posts to the page right away. Keep it real — no links or email addresses.